
Pennant Chart Pattern
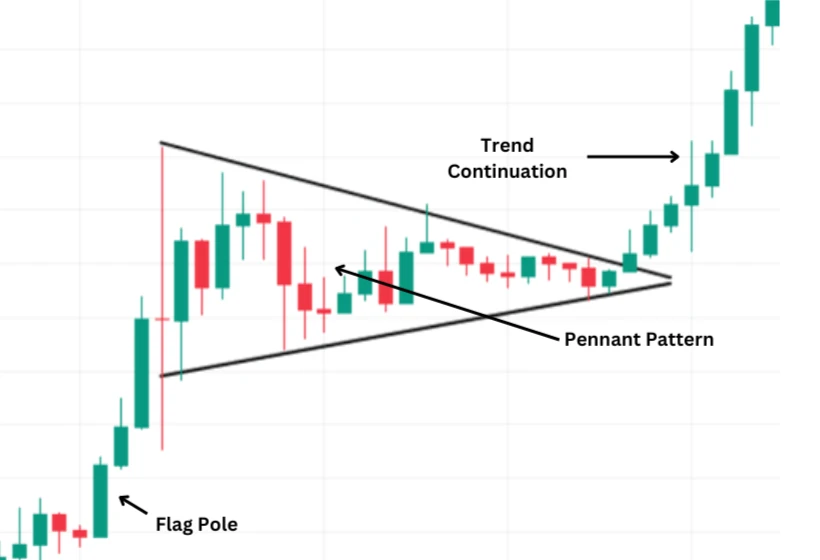
A pennant chart pattern is a type of technical analysis used in the trading market to guess how long a trend will last. People often say that this pattern looks like a flagpole because it looks like a small balanced triangle after a rapid price move. It is marked by trendlines that come together during a short time of stability.
Just like Flag chart patterns, pennants are thought to be good predictors of how the market feels, and they can be seen in both bullish and bearish markets.

How to Understand Pennant Formations?
Pennant forms after a big price change of the flagpole and is characterized by a short time of stabilization during which the price moves within the trendlines, making a triangle shape. This consolidation is a time when buyers aren't sure what to do, so the pressure to buy and sell is almost equal. Usually, the pattern only lasts a few days to a few weeks before ending. A breakout is often followed by higher volume, which means that the previous trend is back on track. Knowing how to spot pennant shapes can help buyers make smart choices since these patterns are good signs for successful trading.
Pennant chart patterns show that the trend will stop for a while and then continue. Within the chart, traders find possible signs that the price will continue to move in the same direction. It usually happens after a big price change, like the flagpole, which can go up or down. After the first move, there is a time of consolidation, during which the price moves within trendlines that are coming together to make a small symmetrical triangle, or "pennant." The consolidation phase is a short break in the market where buyers take a moment to think about what to do next.

How to identify Pennant Chart Pattern?
The most important characteristics of forming a pennant chart pattern are:
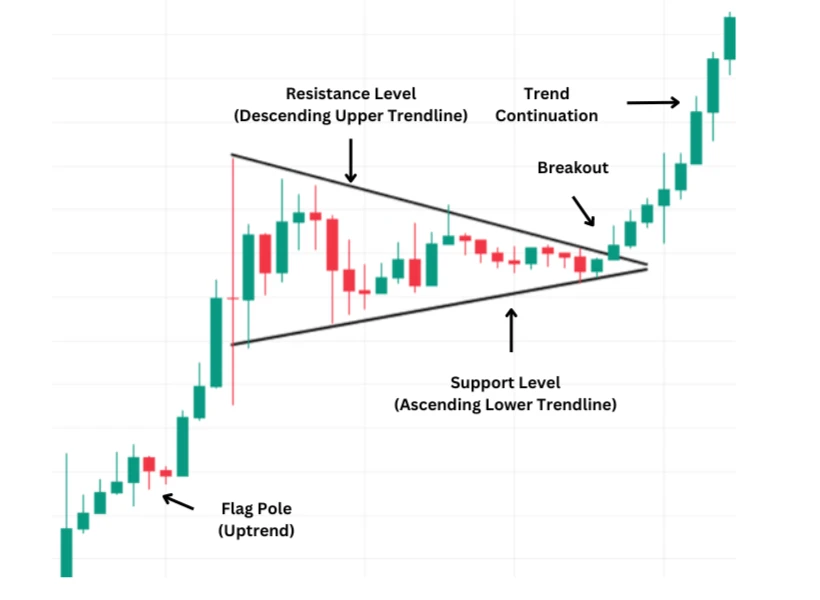
- Crossing Trendlines: It has two trendlines thatcome together to make a small, balanced triangle that looks like a flag or banner.
- Volume Drop: as the pennant forms, trade volume usually drops, which means that the market is consolidating.
- Increase in Volume at Breakout: A breakoutis often followed by an increase in volume, which shows that the trend will continue.
- Direction of Breakout: The pattern is proven when the price moves out of the pennant in the direction of the previous trend.
- Trend Before the Pattern:The Pattern comesafter a strong price move, either in a bullish or bearish way.
- Short-Lasting: Pennant trading patterns only last from one to three weeks on average.
- Continuation: The previous trend is likely to start up again after the short stabilization.
What are the Benefits and Limitations of Pennant Patterns?
Traders can gain from pennant patterns in a number of ways. One of their best features is that they are good at guessing whether a trend will continue. This makes them useful for finding entry places when the market is strongly trending. It's pretty easy to spot the pattern because it has a clear form and prices move quickly followed by a short period of stability. Also, pennant trading patterns can be used on different time frames, which gives traders of both short and long terms more options.
Yet, there are some limitations that can't be do with pennant designs.
One major problem is that fake breakouts can happen, where the price moves in the direction of the breakout but then turns around, which could lead to losses. You need to have a lot of experience to correctly identify the pattern because it can look like other charts like flags or triangles. The pattern is also less accurate when markets are very unstable or noisy because price changes can be random and less predictable. Using pennant patterns alone, without looking at other indicators or market factors, can also lead to incomplete analysis and bad trading choices.
How to Trade with Pennant Patterns
To get the most out of trading with pennant trading patterns, it’s necessary to take a few steps. Firstly, find a strong first price movement, known as "flagpole." Next, look for a time of consolidation where the price moves within trendlines that are getting closer together looking like a small pennant or triangle with equal sides. During this time, traders should look for volume to drop, which means the market is taking a short break.
The breakout from the consolidation phase is the most important trade signal once the pennant pattern has been found. Most of the time, traders take positions in the direction of the rise because they think the previous trend will continue. To avoid getting false signs, it's important to wait for a proven breakout, which is usually shown by a rise in volume. A good way to lower the risks is to put stop-loss orders just below the pennant's lower trendline (for bullish patterns) or above the upper trendline (for bearish patterns).
Traders often find possible profit goals by measuring the flagpole's length and estimating how far away it is from the breaking point. This method helps to guess how the price will move after the rise. Also, to improve your chances of earning money with trades, it's better to use pennant trading patterns along with other basic indicators and research tools. This will give a fuller picture of the market and help people make better decisions.
How to Identify the Breakout?
Finding the breakout in a pennant pattern requires taking several important factors. Traders should first keep an eye on the price movement as it gets closer to the pennant's apex. So that, as the consolidation phase draws to a finish, the price begins to move more in one direction.
A real breakthrough is verified when the price crosses the pennant's trendline boundary with more volume. In case of an upward breakout, the price must be close above the higher trendline; whereas, if the price is near below the lower trendline, it shows a downward breakout.
An important indicator that the breakout is real and not fake is the rise in volume that occurs immediately after the breakout occurs. For extra proof that the breakout is real, traders can look for other technical signs. For example, momentum indicators like the Relative Strength Index (RSI) can help to determine if the breakout is likely to sustain by indicating trading conditions.
By using various techniques together, traders can find breaks from pennant patterns more easily and make better trading.
Strategies for Trading with Pennant Patterns
It's necessary to be focused and have a clear plan. By combining strategies, traders can effectively utilize pennant patterns to spot and perform successful deals while controlling risks. Here are a few helpful strategies:
- Recognize Pattern: Firstly, detect a significant initial price movement that produces the flagpole, then consolidation that makes the pennant. Make sure the consolidation creates a tiny symmetrical triangle.
- Confirmation: Before making a deal, it's recommended to wait for a proven breakout from the pennant. Price should move beyond the pennant trendline with higher trading volume. This can identify a real breakthrough.
- Set stop-loss orders: Place stop-loss orders above the higher trendline for a bear pennant pattern or slightly below the lower trendline for a bull pennant pattern in order to control risk.
- Use additional Indicators: Move beyond the pennant trading pattern analysis and consider combining it with additional technical indicators like MACD, RSI, or moving averages. These indications may assist to determine the strength and durability of the trend as well as provide further proof of the breakout.
- Adapt for Market Conditions: Modify your plan in light of the larger market environment. In highly unpredictable markets pennant patterns may not be as credible. Take into account news about the economy, the general market trend, and other variables that might affect price changes.
- Monitor Volume: Keep an eye on how the volume changes over time. A strong confirmation signal is a big rise in volume during the breakout. Breakouts with low volume are more likely to fail, so it's important for to see a volume rise to support it.
Related Articles
Descending Triangle Pattern
Ascending Triangle Pattern