
On This Page
Support and Resistance: Key Concepts, How to Identify and Strategies
Here is the deal - on the price chart there are always special zones that traders call support and resistance levels. It would seem that they are just lines drawn based on historical data, but not everything is so obvious. These are not just lines, these are zones where market participants are more active, and the price begins to react. Why? Because this is where the interests of large players and ordinary traders are concentrated, the psychology of the market comes into play. And this does not allow the price to move freely. Imagine a situation when the price approaches the resistance level, and sellers suddenly sharply increase the pressure, stopping the upward movement. And in another place, on the contrary, the price reaches the support level, and buyers begin to act aggressively, defending their positions. Traders like you and me constantly monitor such moments in order to more effectively find entry points, minimize risks and increase the accuracy of forecasts.
Here is what is important to understand: support and resistance are entire areas where the expectations and fears of many market participants intersect. To always keep this in mind, and for the purpose of your trading success, read this article.

What is Price Support?
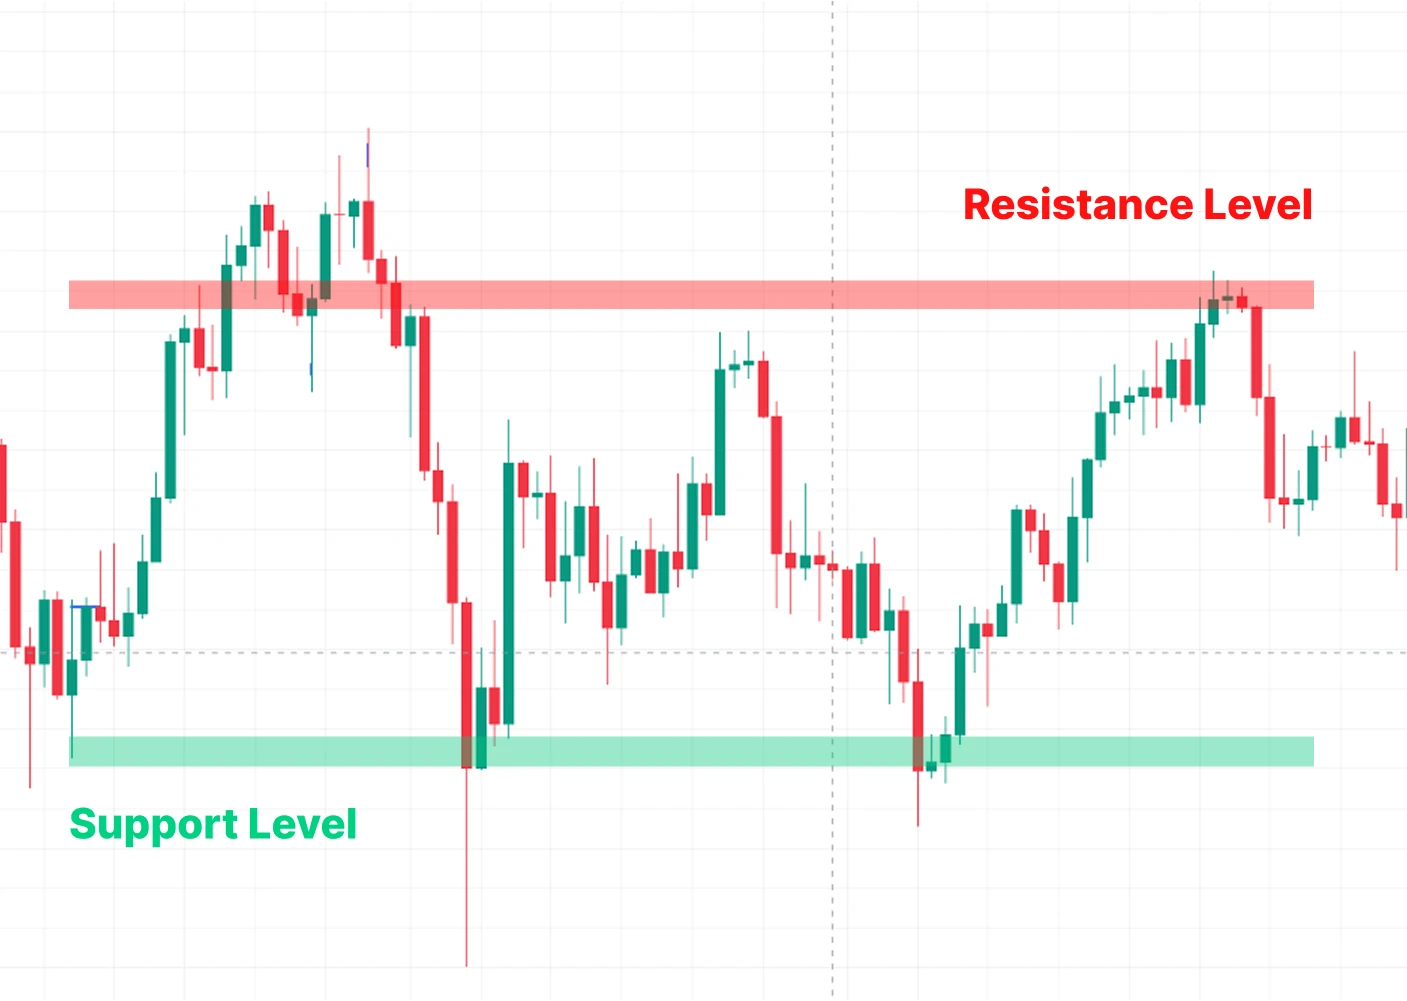
We will start by talking about price support, because this concept is fundamental for anyone involved in trading. In simple terms, this is the level at which the price of an asset constantly meets buyers who are ready to actively enter into transactions. Why do they do this? The answer is obvious: this is where the market considers the asset undervalued and promising for growth.
And here is where the most interesting part begins, because support levels often coincide with historical minimums. Yes, yes, you have probably seen how the price reached a certain point and suddenly began to move up. This is precisely because buyers choose this level again and again to enter long positions. Here, of course, we cannot do without market psychology, which literally controls the decisions of participants. Traders perceive the support level as an area where the risk seems lower and the chances of profit are higher, which is why they are so willing to enter into purchases.
But levels can be different, and it is important to understand this in more detail. Sometimes it is a horizontal line, where the price simply repeatedly “knocks” on the same price threshold. The support level sometimes looks like a slanted line connecting gradually rising lows in the trend. Sometimes these are not lines at all, but moving averages that dynamically move behind the price, creating support for the growing market.
And with all this, it is important to remember one circumstance. If at some point the price breaks through this support level downwards, it means that the balance of power has changed. This is no longer just a correction, but a potential signal for a reversal and strengthening of the downward trend. Buyers are weakening, and sellers, on the contrary, are confidently taking control of the market. So remember that you always need to watch the price behavior near these critical zones.
What is Price Resistance?
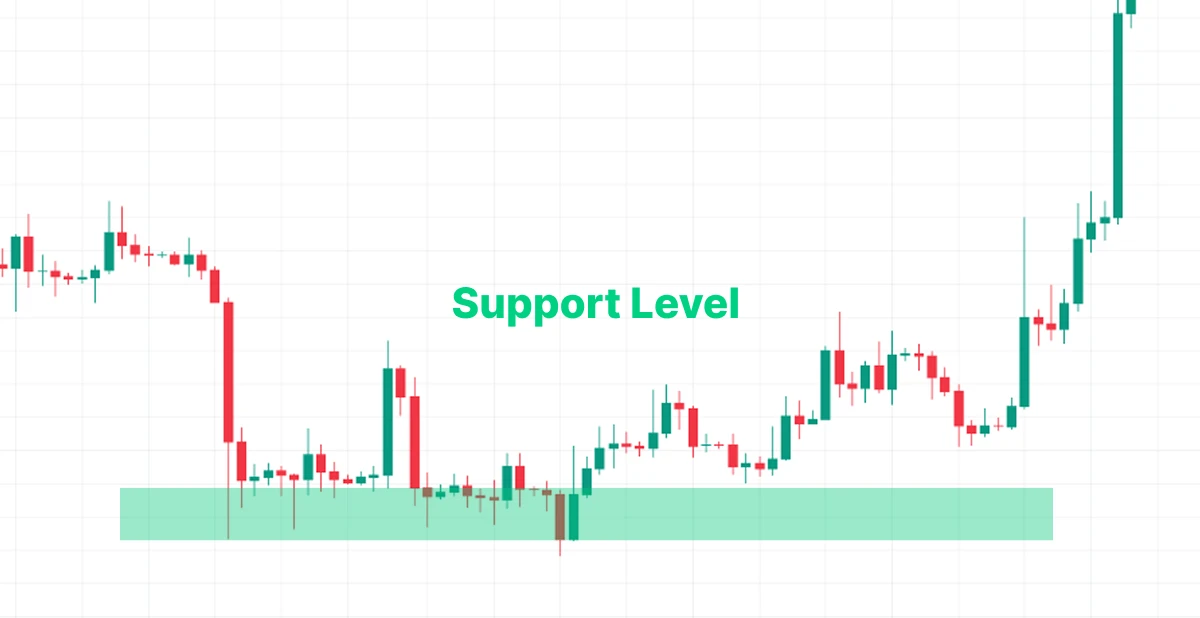
Now let's look at the concept of resistance in the market. The resistance level is a situation when the price of an asset reaches a certain point and faces strong pressure from sellers. I wonder why this happens at all? In fact, the reason is that market participants at this point begin to consider the price unreasonably high. They actively take profits, sell their positions, creating an excess of supply on the market.
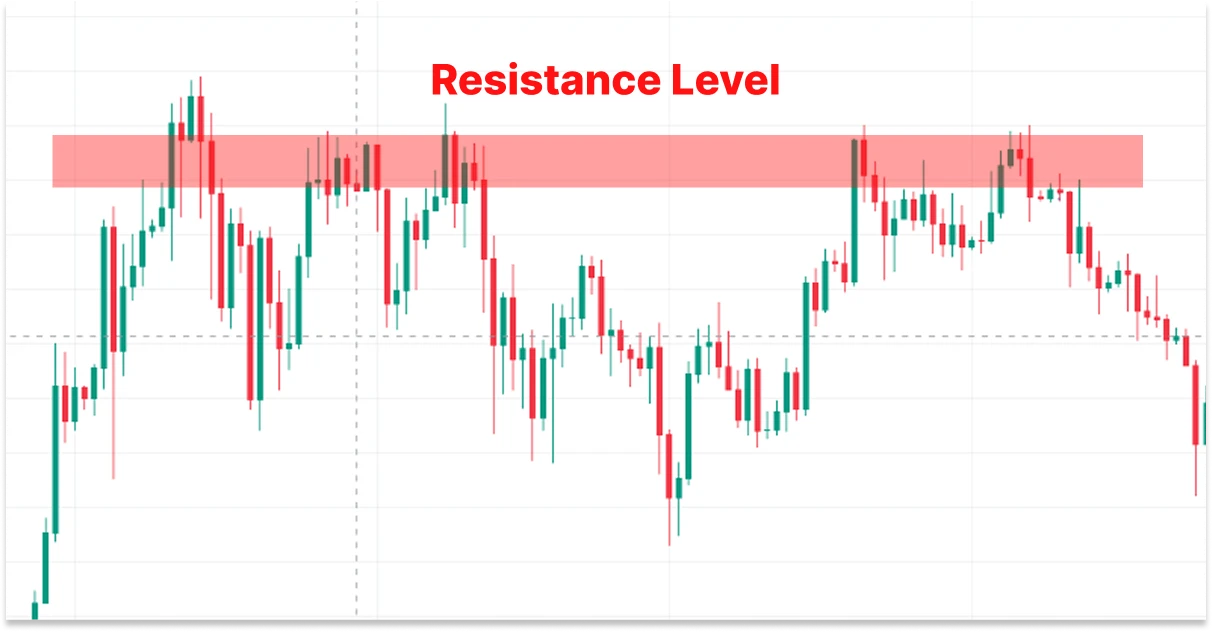
Here, of course, we must not forget about the psychological factor. If you buy and sell cryptocurrency, you’ve noticed market participants perceive these zones as certain limits for further price growth. Often, by the way, such levels coincide with local maximums that have already appeared in the past. It turns out that the market remembers these maximums and reacts to them in the same way in the future.
Now let's try to imagine what exactly such levels look like on the chart. They come in different types. For example, a horizontal resistance level is formed when the price repeatedly reaches a certain mark and cannot overcome it. Another option is an inclined level that connects several successively decreasing maximums, clearly indicating the direction of the downward trend. Another option is dynamic resistance levels created by moving averages, which constantly accompany the price and limit its further increase.
A very important moment is the situation when the price nevertheless breaks through the resistance level. In this case, we can say that buyers are beginning to dominate. The market gradually comes under their control, and this, in turn, can lead to the beginning of a stable upward trend. This is why traders so closely monitor how the price behaves near such significant levels, and this is why we should pay a closer look to the psychology behind it.
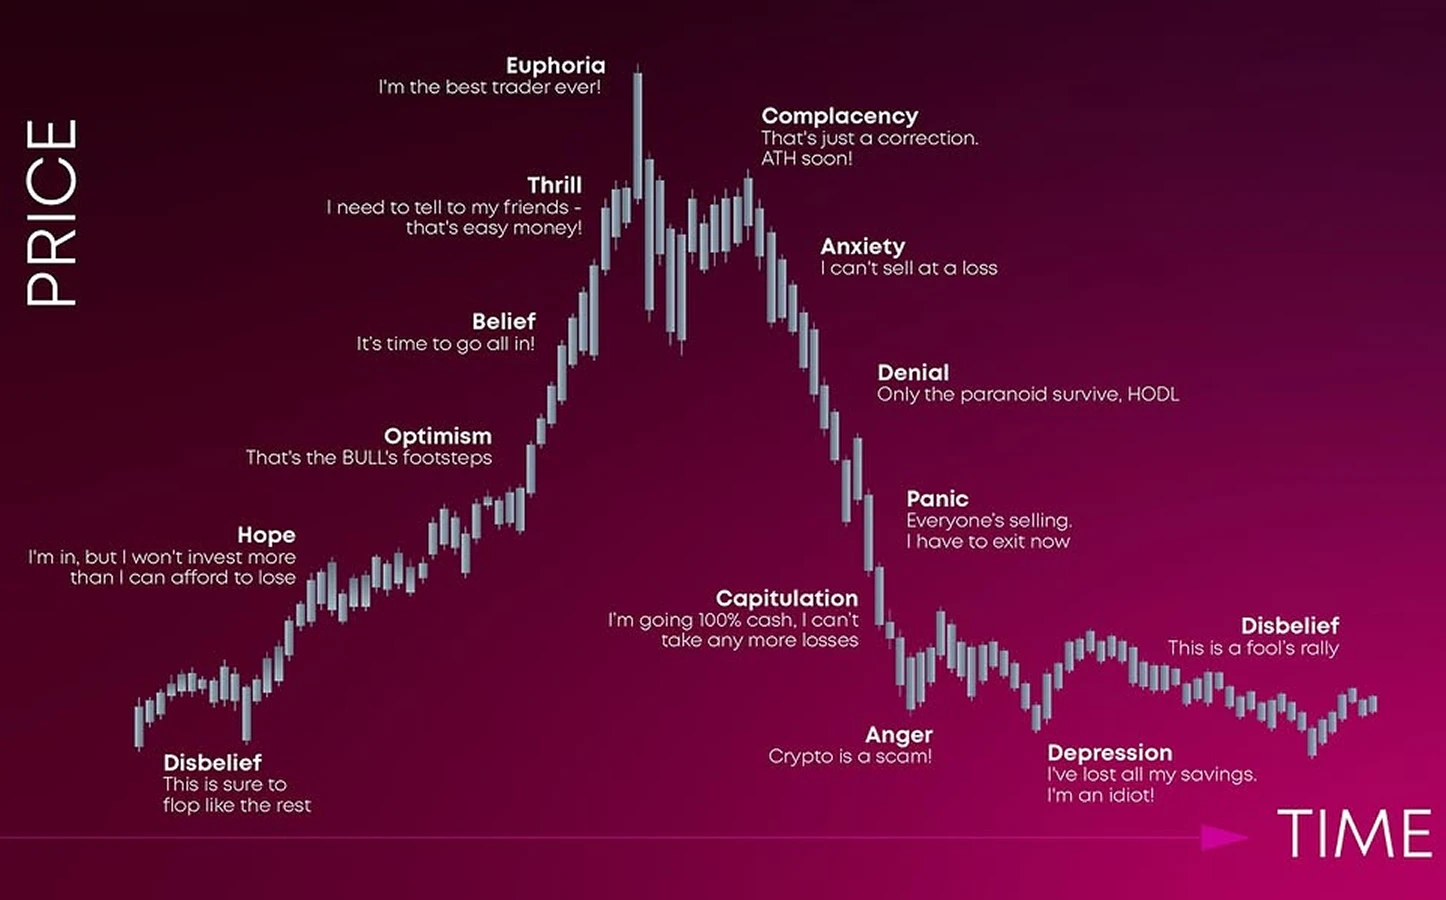
The Psychology Behind Support and Resistance
Now let's look at support and resistance levels from a psychological point of view. After all, in addition to the obvious technical aspects, there are real people with their emotions and expectations behind all these lines and zones. It turns out to be an interesting picture: the charts seem to show numbers and price movements, but in fact they reflect the collective fears and hopes of traders.
Buyer Sentiment
Let's start with how buyers behave. Support levels are usually formed in those areas where buyers are actively entering the market. Why here? When the price starts to fall to a certain level, people suddenly feel the opportunity to make a profitable purchase, hoping for subsequent growth. The reasons for this behavior lie in the psychology of market participants. For example, the fear of missing out on a profitable deal makes them quickly make a decision to buy. In addition to this, previous price lows become a kind of benchmark. Buyers remember that last time the growth began from here, and this further strengthens their confidence.
Seller Sentiment
Now let's consider the opposite situation related to sellers. Resistance levels appear where sellers begin to show maximum activity. As soon as the price reaches a certain height, investors immediately try to close the deals and take the profit. It seems to them that further growth is already doubtful. The psychology of capital protection and the unwillingness to lose the accumulated profit are activated. Moreover, previous price highs serve as important reference points for sellers. It is there that the price previously stopped and turned down. All this increases the desire to sell at these levels.
Identifying Support and Resistance Levels
What do support and resistance levels actually do? They are not just lines on a chart, but rather reference points where the price seems to stumble, slow down, or even change direction. They cannot be ignored. They help traders navigate the market better, making more accurate and informed trading decisions.
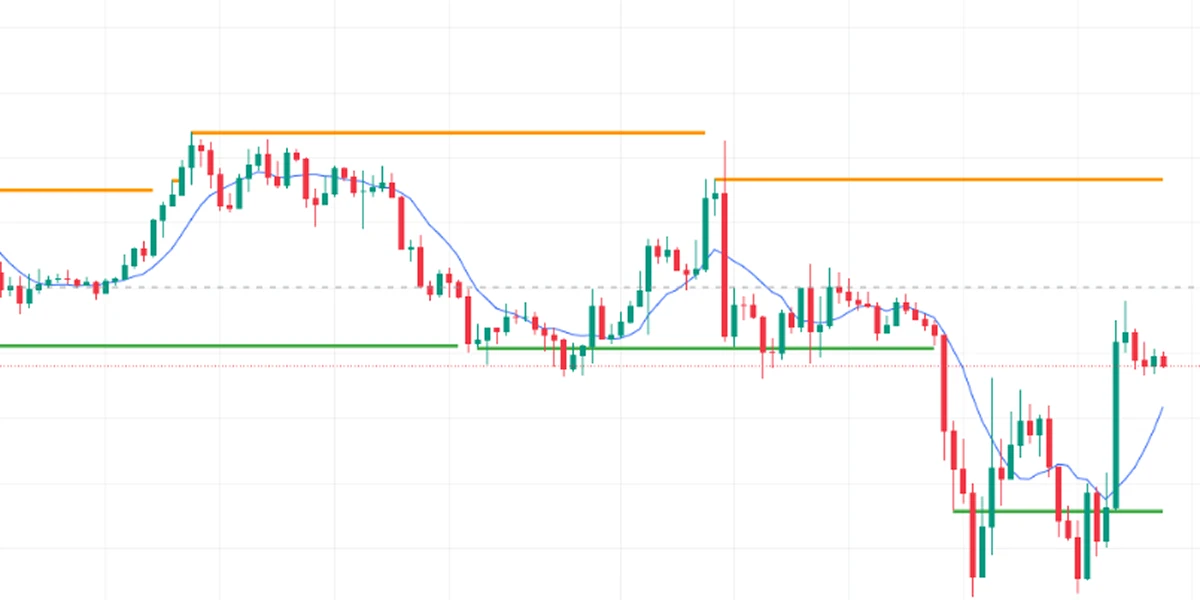
Horizontal Support and Resistance
Let's start with horizontal levels. As a rule, such zones appear where the price has repeatedly stopped in the past and are formed around historical highs and lows of the asset price. For example, look at how it works - if the price dropped to $50 several times in a row and each time began to move up from there again, then this level can be confidently considered a horizontal support zone. And if the price could not break above $100 again and again, then this zone becomes horizontal resistance.
Trendline Support and Resistance
Now let's move on to trend support and resistance levels, which are slightly different from horizontal ones. Such levels are always inclined, because they directly depend on the direction of the current trend. The support line in an uptrend passes through a series of consistently growing minimums and creates the lower boundary of the upward price movement channel. Well, the resistance line, on the contrary, is drawn through several gradually decreasing maximums, forming the upper boundary for a downward trend. As long as the trend continues, the lines remain relevant, but if the trend changes, they must be adjusted and rebuilt.
Optimal Time Frames for Support and Resistance Analysis
Another important point to consider is the choice of appropriate time intervals, or timeframes, for determining support and resistance. Here, everything depends on the specific strategy used in trading. For example, long-term investors who hold positions for months and even years usually prefer to look at weekly or monthly charts. This way, they see global levels that can affect the overall situation. Medium-term swing traders often work with daily or 4-hour intervals, which allows them to catch medium-term price movements. Now, there are people who think about which crypto to buy today for short-term; and short-term traders who make trades every day, on the contrary, use shorter intervals: 15-minute or hourly charts to react to price changes as quickly as possible.
Key Laws of Support and Resistance
Everything we have discussed is the live dynamics of the market, a reflection of the fears and hopes of traders, their struggles and expectations. We have discovered a whole hidden layer of how the price moves and why it sometimes seems to hit an invisible wall, and then suddenly breaks through, as if breaking loose from its chain.
Imagine how easily a level can change its role. Just now it served as a reliable support for the price, and in an instant it became an obstacle that cannot be overcome. Why does this happen? The thing is that the market is thousands of decisions, millions of orders; we now realize how important the number of times a level is touched. If the price has already hit the resistance several times, but could not break through it, then there is a powerful wall of orders hidden there. And if it breaks through? Then the energy of the accumulated pressure breaks out, and the price rapidly rushes in a new direction.
It is amazing how all this is connected with volumes. It is like the voice of the market, hidden behind candlestick patterns. When the price approaches a high volume level, there is a real battle between the bulls and the bears. Who will win? If the volumes are growing during a resistance test, this may mean that buyers are going to break higher. If the volumes are sluggish, then the resistance will remain strong, and the price will turn back.
Recognize and remember that fresh support and resistance levels are much more important than those that were left far in the past. The market lives in the moment. No one looks at the marks that were important a year ago if the price has recently drawn new benchmarks.
And finally, remember the role of psychology. These are not just numbers, not dry mathematics. People intuitively like round numbers, so the levels of 100, 1000 or 5000 dollars often become points where the market either slows down or explodes in motion.
All this does not work separately. We realized that you need to analyze the levels in a complex. First look at the history of touches, then at volumes, consider how fresh this level is, and then think about psychology. This is the only way to see the market not as a chaotic change in prices, but as a natural struggle between supply and demand.
Best Technical Indicators for Support and Resistance
Now the most interesting part begins, because we are approaching the topic of indicators. Technical indicators. Everyone has heard of them, everyone uses them, but... the question is - do they really work, or is it just a convenient self-deception? Let's think about it.
Moving Averages
Take, for example, moving averages. What do they even do? They take the price for a certain period, smooth out all the fluctuations and give us a certain line that supposedly shows the direction of the trend. Okay, that sounds logical. But what do we really get?
A moving average can be simple, when everything is calculated as a regular arithmetic mean. Or exponential, in which case more importance is given to the latest prices. The logic is clear: the latest movements are more important than what happened a week ago. But the question is in what context to use this? One trader sets a 10-period, another - 50, a third generally works on 200. Who is right? Maybe everyone. Or maybe no one.
For example, in an uptrend. The moving average is under the price, and it seems to support it from below. Like a soft pillow. In a downward direction, it's the opposite. The line from above presses and doesn't let you pass. But know that this is just a reflection of the past, which reacts with a delay. You wonder why millions of traders pay attention to it.
The answer is - because it's not only the line itself that works, but also the belief in it. The market lives on expectations, and when many people believe in the same thing, it begins to affect the price. This is where the real resistance and support are.
Fibonacci Retracement
Now about Fibonacci, this is a whole separate story. This is a sequence that an Italian mathematician invented, and not for the market, but for nature. And for some reason, humanity took it and applied it to charts. It works in a strange way, because those levels - 23.6, 38.2, 50, 61.8 - they appear again and again. As soon as the price corrects, everyone starts looking at it: "Aha, it's 61.8 now, there might be a reversal here."
Why did numbers that initially had nothing to do with finance suddenly end up at the center of trading strategies you ask? Because market psychology loves patterns, so if we find a pattern, even an artificial one, we feel calmer.
Remember! It does not promise, it only suggests. Fibonacci gives entry points, profit targets, helps to place a stop, but it does not guarantee anything.
So what, use everything separately? No, it is more interesting when we start combining Moving Averages plus Fibonacci levels. Or even better, add volumes, trend lines or crypto patterns. The levels confirm each other, and thus, decisions become not just intuitive, but logically supported.
But the question still remains: maybe it is better to feel the market, or should I still rely on the data?
Intuition without a base is a risk. And technical analysis without a sense of the moment is mechanics. Hence, it’s the best time to talk about trading strategies.
Trading Strategies
Trading strategies are fundamental in technical analysis. They will help you make informed decisions about entering and exiting the market based on the price action around these key levels.
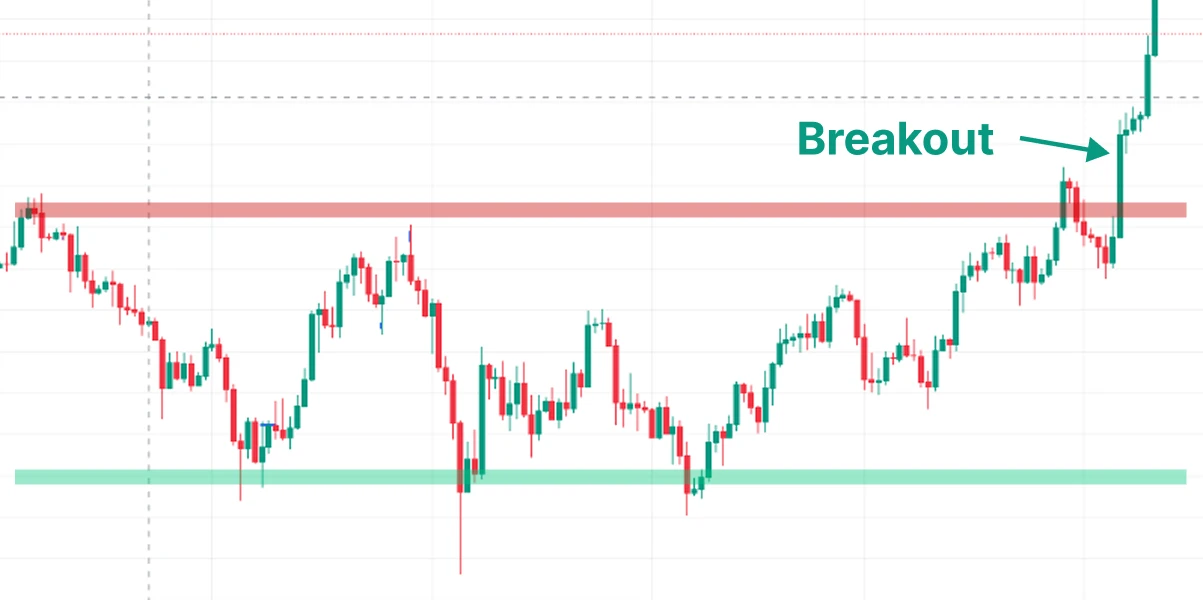
Support and Resistance Breakouts
Now, look at this thing. When the price suddenly takes and crosses a level - support or resistance - this is called a breakout. And this can mean two completely different scenarios. Either the trend is changing. Or, on the contrary, it continues. And here comes the most interesting part.
Let's say there was confident growth. The price was going up. Everything was beautiful. And suddenly - it broke through the support. This is no longer just a correction. This can be the beginning of a fall. Because if buyers no longer hold the level, it means there is not enough strength. That's it. What was an upward trend is over.
And now it's the other way around. A fall. A downward trend. Everyone is waiting for the bottom. And then - the price breaks through the resistance. This is not just a surge. This can be a signal: that's it, a reversal. And here it is important not to guess, but to watch how it all happens.
Volume is the key. If the breakout occurs on high volume, this is serious. This means that there is strength behind the movement, and not just a random surge. If there is no volume, it is better to wait. Because a false start often happens. The so-called false breakout.
This is the moment when you see that the price has passed the level, but nothing happens. It does not consolidate. It comes back. And quickly. This is a fake. This happens all the time. Especially if you are in a hurry. You enter on emotions. And then you look - and you no longer understand what to do with this position.
To avoid this, traders wait. They wait for the candle to close. They wait for confirmation. Sometimes they wait until the price returns to the level - to test it from the other side. This is called a retest. Now if after the retest the level holds - this is a completely different story. Here you can enter calmly.
Breakout Failure Identification
Sometimes a breakout is just a continuation. For example, the trend is already strong, and the price simply knocks down the resistance and goes further. Then you do not need to look for a reversal where there is none. You need to understand that the market is not obliged to reverse just because the level has worked ten times before.
It all depends on the context. On what was before. What is the trend? How was the volume? What candles? And all this together gives you an understanding - is this an entry, or is this a trap.
The most important thing is not to think that a breakout always works the same way. There is no template. But there is a structure. There are signs. And there are mistakes that can be avoided if you just wait a little and watch.
Support and Resistance Bounce Plays
Okay, now let's talk about rebounds, which are based solely on accuracy, that we may or may not have. Not guessing, not "what if I get lucky", but a clear understanding of how the price behaves at the levels.
Bounce Entry Timing
When the price approaches a level, you watch how it behaves: does it slow down, does interest appear, and is there a reaction at all, because the level itself without confirmation is just a line on the chart.
If a reversal candle, such as a hammer or an absorption, starts to form in this zone, this is the first serious signal that market participants are starting to act, and you are not the only one who sees sense in this level.
And if indicators like RSI or MACD also show divergence - say, the price makes a new minimum, but the oscillator does not - this reinforces the idea that the current movement is losing strength, and the market is ready to reverse.
This is a signal: something is breaking. Plus, of course, overbought and oversold zones. If the market has gone too far, the oscillators scream about it. Not literally, of course, but visually visible. RSI is around 70 or vice versa - below 30. This does not mean that everything will definitely turn around, but if it happens at a level - the chance is high. Here you can already think about entering.
Bounce Target Levels
But it is not enough to enter. You need to understand where you want the price to go. That is, the goals. Just sitting in a position is not a strategy. The goals must be real. Not dreams. The price has reached the nearest strong level — fix it. The market has already gone there. There may be a rollback. Fibonacci? It works. Especially if it coincides with the previous zones. 38.2, 50, 61.8 - yes, it sounds trivial, but as a reference point - very much so. Sliding? Yes, they are not for precise entries, but as a movement target - excellent. Especially if it is a 200-period one. The market sees it. Everyone sees it. A rebound is about a reaction. Not about a guess. Not about the expectation that “it should rebound”. But about what is already happening on the chart. You wait, you see, you act. That's all.
Market Structure Analysis
If we talk about the market structure, this is a completely separate layer. You have never even thought about how much more voluminous everything is than just candles and some indicators. This is where a completely different understanding begins.
Volume Profile Identification
There is such a thing as a volume profile. This is not just where the price was, but where transactions actually took place at this price. Not in the sense of "the price touched and left", but specifically trading. If there were a lot of transactions in a certain price range, it means that it was really interesting there. Someone entered, someone exited, both sides were active. These zones can be perceived as fulcrums. As if the market is clinging to something there.
And now the opposite. There are areas where the price just went straight through without resistance, without delay. There are few such zones, but they are important. Because if the market gets there again, most likely, it will quickly pass them again. No one traded there, no one held the line.
Order Flow Dynamics
And here's another thing. If you look at the order flow, it will be a revelation. Because you don't just look at the chart, you start seeing how the orders are being executed. Right now. Who's buying. Who's selling. At what speed. At what price. If there's pressure and everything is in one direction, you can see it.
You see where the limits are. And then you look at the trade feed and you see what's actually been executed. You figure out very quickly who's in charge.
Institutional Order Flow
Then it dawns on you that you're not the only one watching the market. There are big players. The ones with real volumes. If you see a surge in activity, a sharp increase in volume, a move that's not typical, it's almost always them. It's not a fact, but it's very similar. And if all this is happening in an area where there was nothing before, it could be an entry. Or an exit. And that's important.
Market Maker Positioning
Market makers. Before that, you’d think it was something boring. But they really move the structure. Not in the sense of "pushing the price", but in the sense of creating space in which you can trade. Their quotes are always in the order book. They make the market more stable, if you think about which crypto to buy today for long-term. As long as they are there, you can enter and exit without fuss. But if they disappear, everything starts shaking.
All this together gives a very clear picture. Not perfect. But deeper. You don't just look at the price. You understand what is happening inside it. Where the people and the movement are.
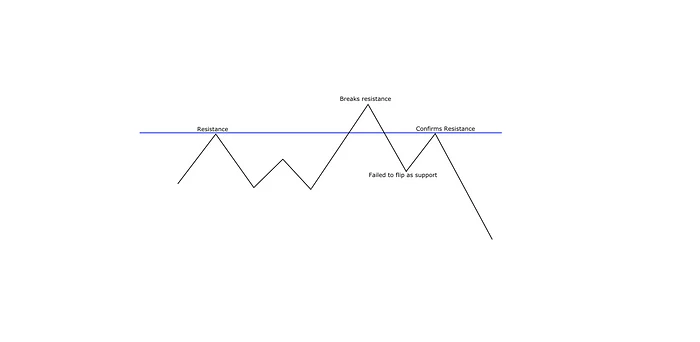
Support and Resistance Role Reversal
An interesting aspect of support and resistance levels is their ability to change roles: a support level, after being broken downwards, can become a resistance level, and vice versa. Let’s see how it looks.
Example of support becoming resistance
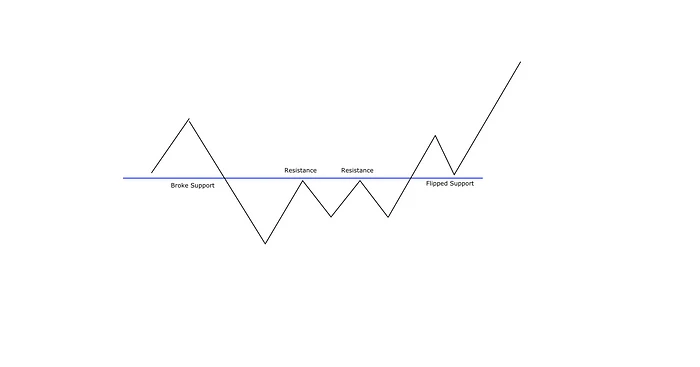
Example of resistance becoming support
Support and Resistance Levels in Risk Management
Yes, levels are not only about entry and exit. It's also about protection. About how not to drain your deposit on one unsuccessful deal. How to know in advance where you exit if everything goes wrong. How to understand where to put a stop. Where to fix the profit. And what to do with the position size so as not to overdo it.
Stop Loss Placement
Yes, levels are not only about entry and exit. It's also about protection. About how not to drain your deposit on one unsuccessful deal. How to know in advance where you exit if everything goes wrong. How to understand where to put a stop. Where to fix the profit. And what to do with the position size so as not to overdo it.
For example, stop loss is a clear rule. If you enter a purchase and see a support level below you, it is logical to put a stop just below it. Because if this level is broken, then you are no longer in the right deal; The scenario is broken, there is nothing more to catch there.
It is the same with selling. You open a short - you look where the nearest resistance is. That is where you put a stop, just above. Because if the price breaks through this resistance, then the bearish idea no longer works.
And this is all a system, where each deal has a clear boundary. Beyond it - not a step.
Position Sizing Optimization
And inside this frame you are already moving. You calculate how much you can put into a position. Not by eye, but based on where your stop is. The closer it is to the entry, the more you can enter. The further away, the more carefully. You can even call it mathematics.
But what if the market is volatile? Like, the price is just throwing back and forth? That's a different story. Even if the level is clear, even if the stop is in place, the position size still needs to be cut. Because the movement can be sharp, and in order not to get hit on the head in a second, you remove the excess in advance.
And it turns out that levels work not only as entry benchmarks, but also as the basis for the entire risk management system. Everything is calculated from them. Stop. Volume. Potential profit. And if you ignore the levels, you are essentially trading in the dark.
Conclusion
To be honest, while we were looking at support and resistance levels, we should have been surprised by how much deeper it all is than it seems at first glance. When a support level suddenly turns into resistance, it’s as if the market is testing who will hold up and who will break.
What should have been especially impressive is that technical analysis helps us understand people’s behavior in the market. Now, when we look at the future of crypto, we begin to understand what lies behind each movement.
Another important point that should have made us think is the influence of large players on the market. Market makers and institutional investors move the price, and retail traders often just follow them. In order not to end up on the losing side, it is important to understand how volumes are distributed.
And finally, risk management. Without it, even the most accurate analysis can lead to losses.
Now we understand that this is a whole system in which strategy, psychology and analysis are intertwined. Each level on the chart is not just a line. And the deeper we delve into these processes, the better we begin to understand the very logic of the market.
Related Articles
Flag Pattern: Definition, Types and Trading Strategies
The Golden Pocket Explained